

Uncertainty
A video installation of Kepler’s Tally of Planets for the ArtCenter’s Williamson Gallery, 2016–2017
The Antarctica Series
Big Sky Documentary Film Festival, 2018
McMurdo Station
Rooftop Film Festival, 2018
Under a Cracked Sky
Tribeca, San Francisco, Milano, Nantucket, Haifa, SIGGRAPH, Sydney, Busan, Teknopolis, Imagine Science and Dutch International Science Film Festivals, 2017–18
Seeking Pluto’s Frigid Heart
Tribeca, San Francisco, Seattle and Paris Film Festivals, 2016
How to Draw the Coronavirus
Paris Review, 2020
Digging deep into “Under a Cracked Sky”
Witness, 2018
What Is Elegance in Science?
The New Yorker, 2015
Infographic Answers
Advanced Photoshop, 2014
Everyday Information Design:
정보 디자이너 조너선 코럼
g: Magazine, 2011
The Information Sage: Profile of Edward Tufte
Washington Monthly, 2011
With one fix: I took Tufte’s graduate course as an undergraduate. I was not a grad student.
Calamity Jon
The Boston Globe, 2005
Holy Grail’s Bridgekeeper Question Finally Answered
Daily Llama, 2003
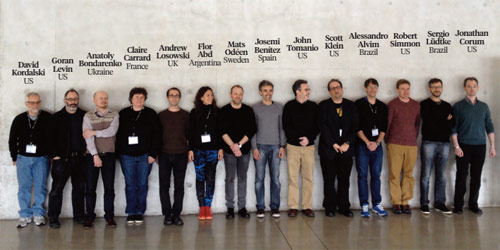
Malofiej22 Jury
2014
Netter Atlas Medical Illustration Competition
2013
My work appears in the permanent collections of:
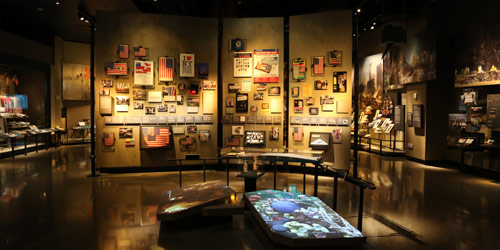
The National September 11 Memorial & Museum
The Library of Congress
The Smithsonian
My graphics appear in:
Evolution: Making Sense of Life
by Carl Zimmer and Douglas Emlen, Forthcoming editions
The Visual Elements
by Felice Frankel, Forthcoming
The Confidence Men
by Margalit Fox, 2021
Conan Doyle for the Defense
by Margalit Fox, 2018
Data Visualisation: A Handbook for Data Driven Design
by Andy Kirk, 2016
Mind the Map
by Gestalten, 2015
Design. Designer. Designest
디자인. 디자이너. 디자이니스트
by Fritz Park, 2014
Infographics Designers' Sketchbooks
by Steven Heller, 2014
Temperature Rising
by Justin Gillis, 2013
The Best American Infographics 2013 and 2015
by Gareth Cook, 2013–15
A Life in Illustration: The Most Famous Illustrators and their Work
by Gestalten, 2013
The Riddle of the Labyrinth: The Quest to Crack an Ancient Code
by Margalit Fox, 2013
Human Geography
by Jon Malinowski and David Kaplan, 2012
Visual Complexity: Mapping Patterns of Information
by Manuel Lima, 2011
What Technology Wants
by Kevin Kelly, 2010
”Jonathan Corum, master designer and illustrator, rendered the charts on these pages in his distinctive, radically clear style.” — Kevin Kelly
The Best of Newspaper Design
27th,
28th,
29th,
30th and
31st editions, 2006–10
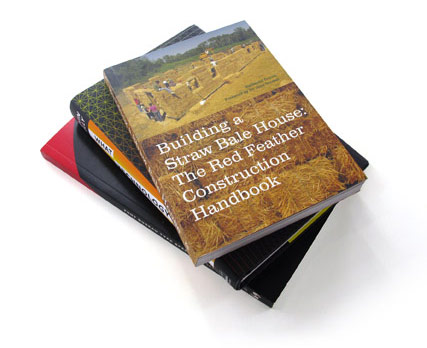
Building a Straw Bale House
by Nathaniel Corum, 2005
American Type Design and Designers
by David Consuegra, 2004
The Income Tax Map
by Shari Motro and Joshua D. Blank, 2002–22
Graphic Design USA 18
by AIGA, 1998
Font Bureau Type Specimens
1st, 2nd and 3rd editions, 1996–2001
My graphics appear in:
Nature Geoscience
Transient liquid water and water activity at Gale crater on Mars, 2015
Stanford Law Review
Preglimony, 2011
Scientific American
Fake Botox, Real Threat, 2010
Legal Affairs
Lessons From the Swiss Cheese Map, 2005
The New York Times
More than 1,500 graphics, 2005–present